Theme 1
Lunar Polar Volatiles
To understand how polar ice deposits evolve over time, and how to detect and interpret buried ice.
Background
The polar regions of the Moon have areas that are permanently shadowed from direct illumination from the Sun. The temperature in some of these permanently shadowed regions (PSRs), is cold enough to retain water ice and other volatile compounds for billions of years. These PSRs potentially host a record of the volatile influx to the Earth-Moon system that spans a much longer time than the record available on Earth. Water is also an important resource for exploration because it can be split into hydrogen and oxygen, which can be used as propellant for rockets. Being able to mine and produce propellant on the Moon could reduce the cost of space exploration.
Question(s)
- What would we see if we went back to the LCROSS impact site?
- What measurements would we want to make and how would those measurements reveal the effects of impacts and thermal processes in lunar PSRs?
Tasks
- Modeling ice deposition, impact gardening, and thermal diffusion
- Impact experiments into icy regolith analogs
- Radar data analysis informed by numerical and experimental models
- Connecting models to observations and identifying key future measurements
Team

Netra S Pillai


Shyama Narendranath
Anne Virkki
Sriram Bhiravarasu
Toshi Hirabayashi
Graphics
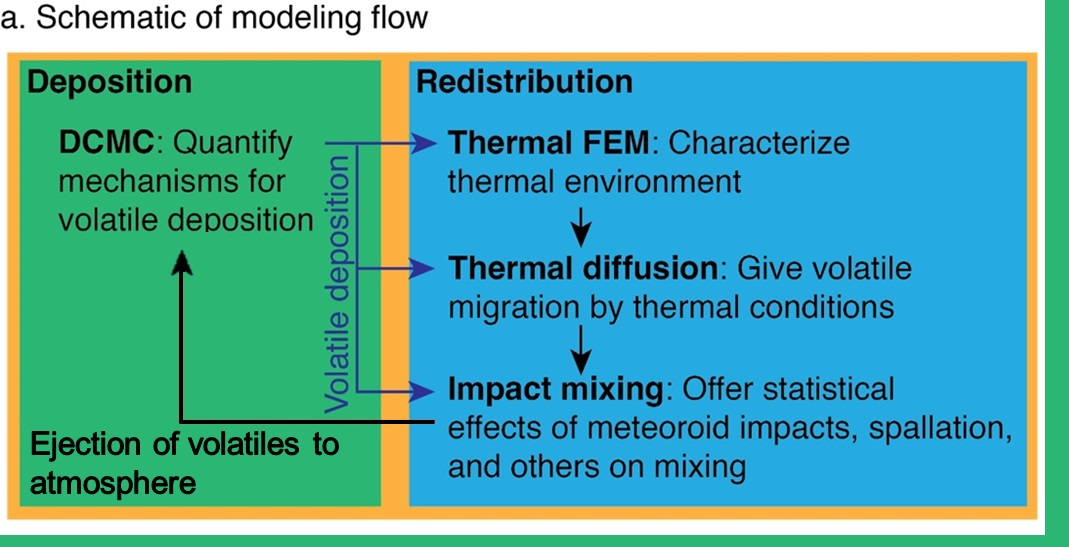
Schematic of model integration to quantify the effects of multiphysics processes
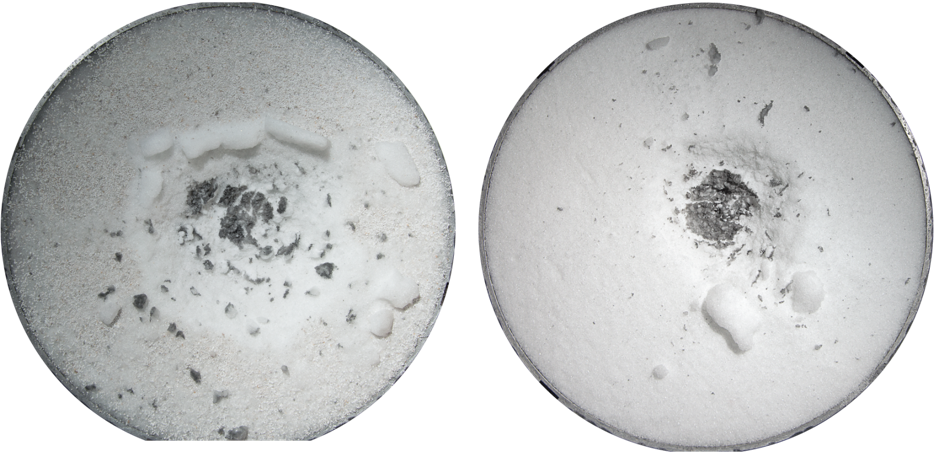
Two examples of craters formed experiments at the NASA Ames Vertical Gun Range (AVGR) into targets of porous ice (left) and porous ice covered with a veneer of porous silicates. Each target is ~50 cm across. The addition of a silicate veneer changes crater size and morphology. The proposed experiments into silicate-ice mixtures (as opposed to the layered target at right) will systematically assess how the volume fraction of ice affects cratering outcomes.

Overlay of Arecibo S-band radar observations of SC backscatter onto a MESSENGER MDIS image of the north polar terrain from Rivera-Valentín et al. [2022]. SC radar backscatter was clustered into classes by intensity using the k-means algorithm. The color denotes the k-means class from high SC backscatter (yellow) to low backscatter (blue). In their work, Rivera-Valentín et al. [2022] showed that the differences in radar backscatter can be attributed to differences in ice volume fraction.